Charts
Data and Graphs
Charts collected for this page, with the credit that came with each image.
Supplied charts
These images were provided for the page and are shown unchanged.
Provided image
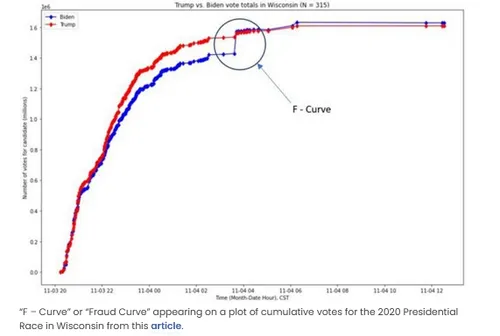
Cumulative vote totals labeled as the 2020 presidential race in Wisconsin
Open the original image (500 by 336 pixels)
Cumulative vote totals for the 2020 presidential race in Wisconsin, as labeled on the image, including an F-Curve note.
Provided image
The 15% band, as labeled on the supplied image
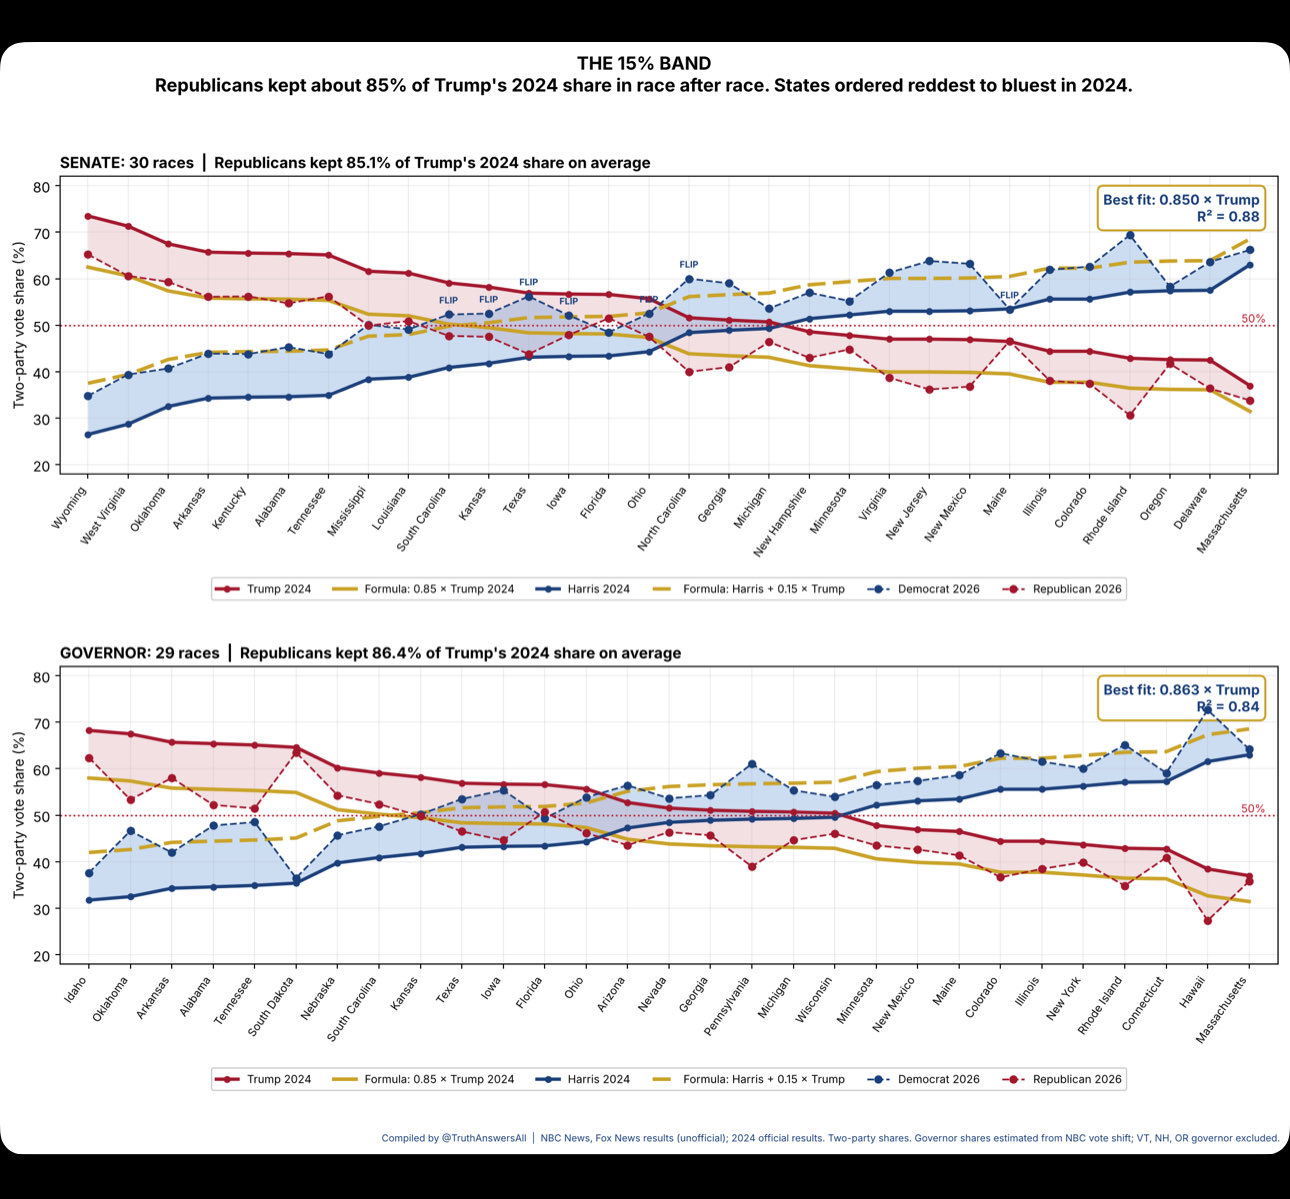
Open the original image (1,290 by 1,199 pixels)
Senate and governor charts labeled The 15% band, comparing 2024 Trump and Harris shares with 2026 race markers.
Provided image
Early votes, 2026 compared with 2024 final, as labeled on the supplied image
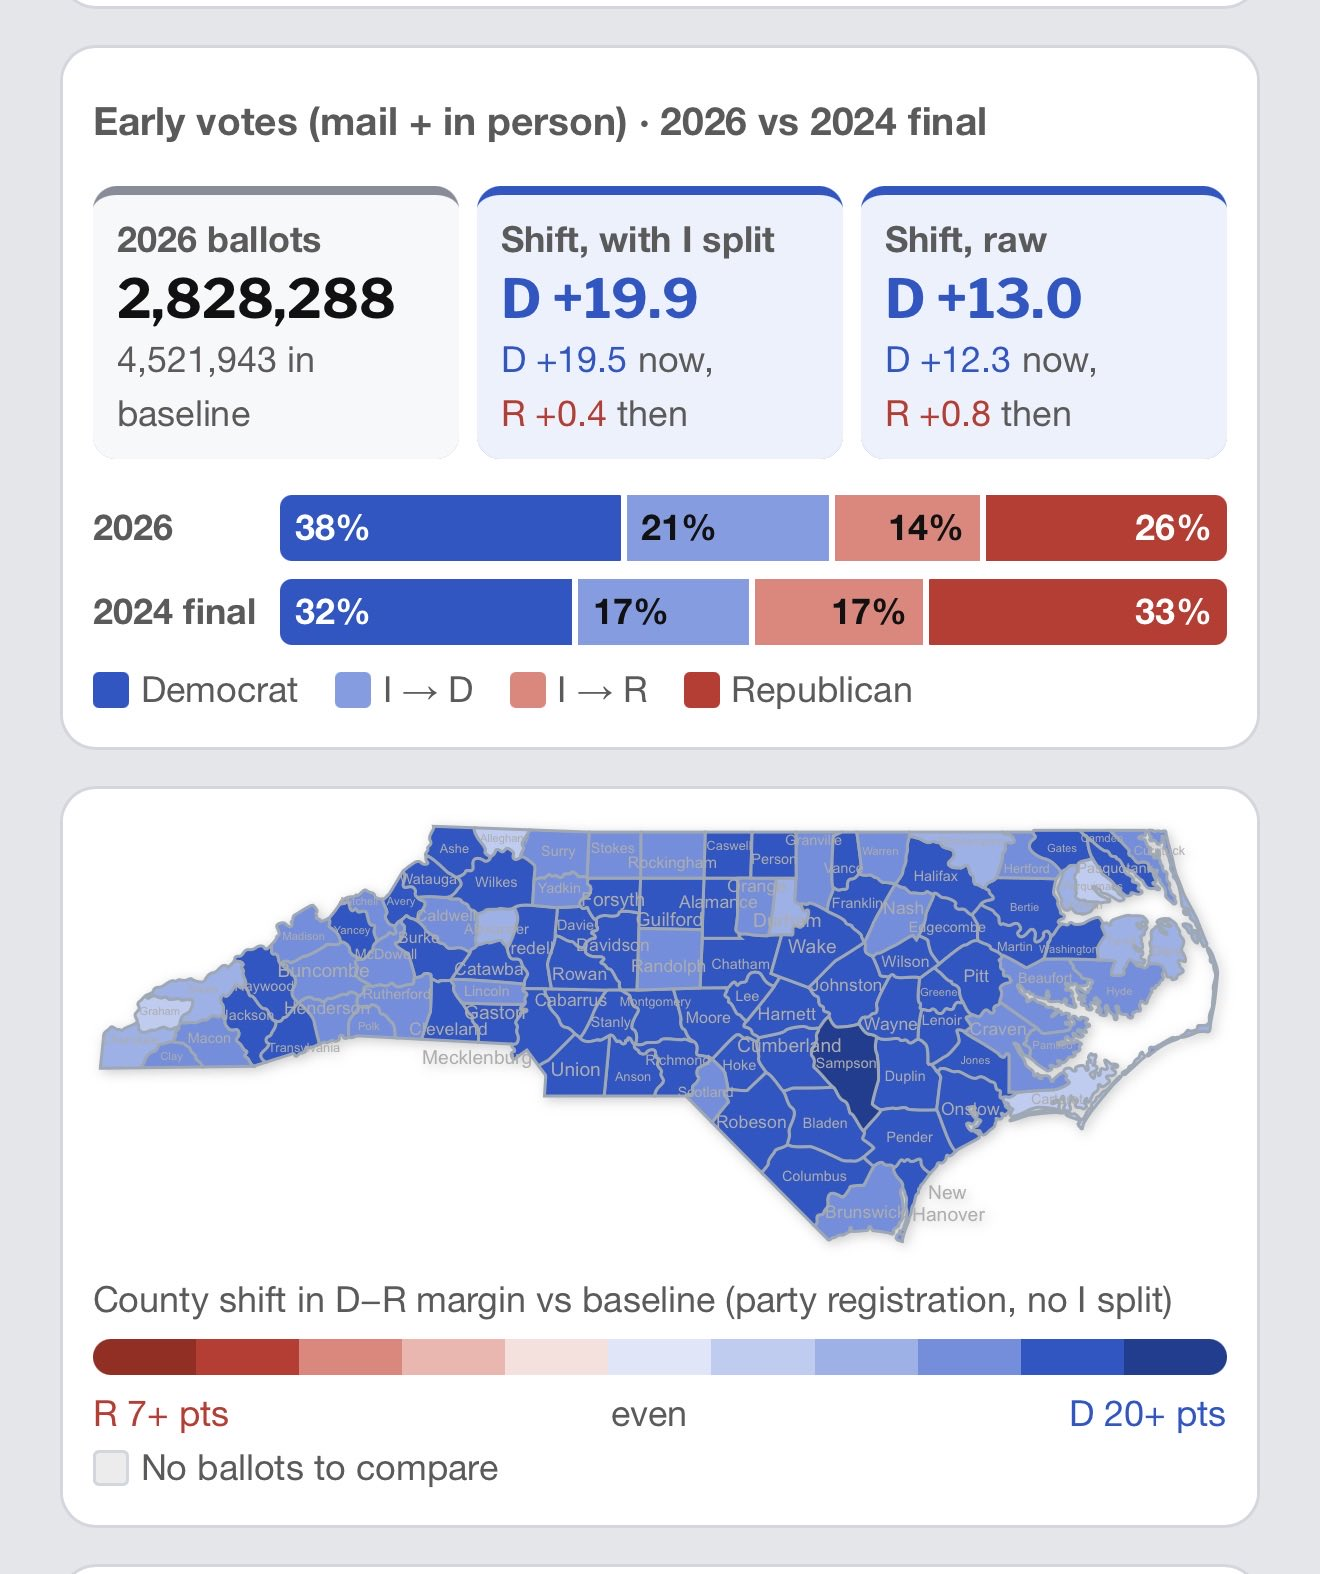
Open the original image (1,320 by 1,574 pixels)
Early votes, mail and in person, 2026 compared with 2024 final, as labeled. Includes a North Carolina county map of party-registration shift.
Provided image
Texas county-map comparison, 2016–2026
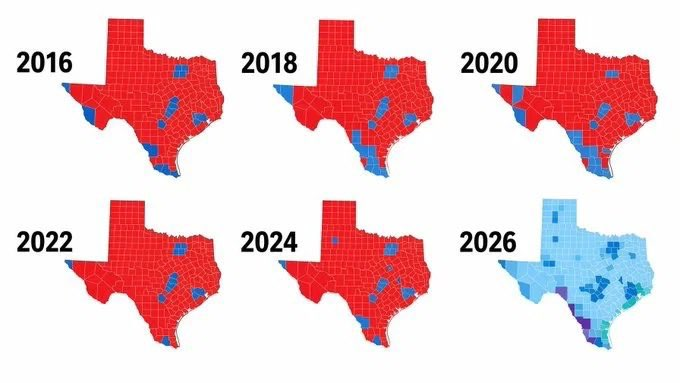
Open the original image (680 by 383 pixels)
Texas county-map comparison, 2016–2026 (as labeled in supplied image); metric and source not supplied.
Illustrative sample charts
Sample data.