Demo — submissions disabled

Charts

Data and Graphs

Charts collected for this page, with the credit that came with each image.

Supplied charts

These images were provided for the page and are shown unchanged.

Provided image

Cumulative vote totals labeled as the 2020 presidential race in Wisconsin
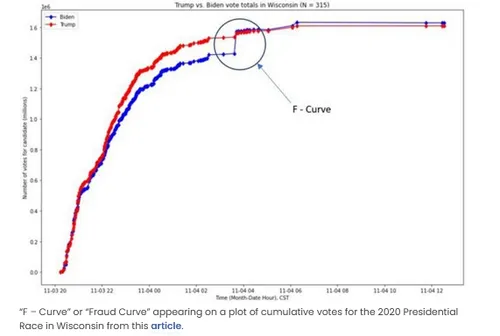
Supplied chart titled Trump versus Biden vote totals in Wisconsin. Red and blue lines show cumulative votes, with an F-Curve annotation on the image.

Open the original image (500 by 336 pixels)

Cumulative vote totals for the 2020 presidential race in Wisconsin, as labeled on the image, including an F-Curve note.

Source: Image provided by site owner; original source and underlying dataset not supplied.

Provided image

The 15% band, as labeled on the supplied image
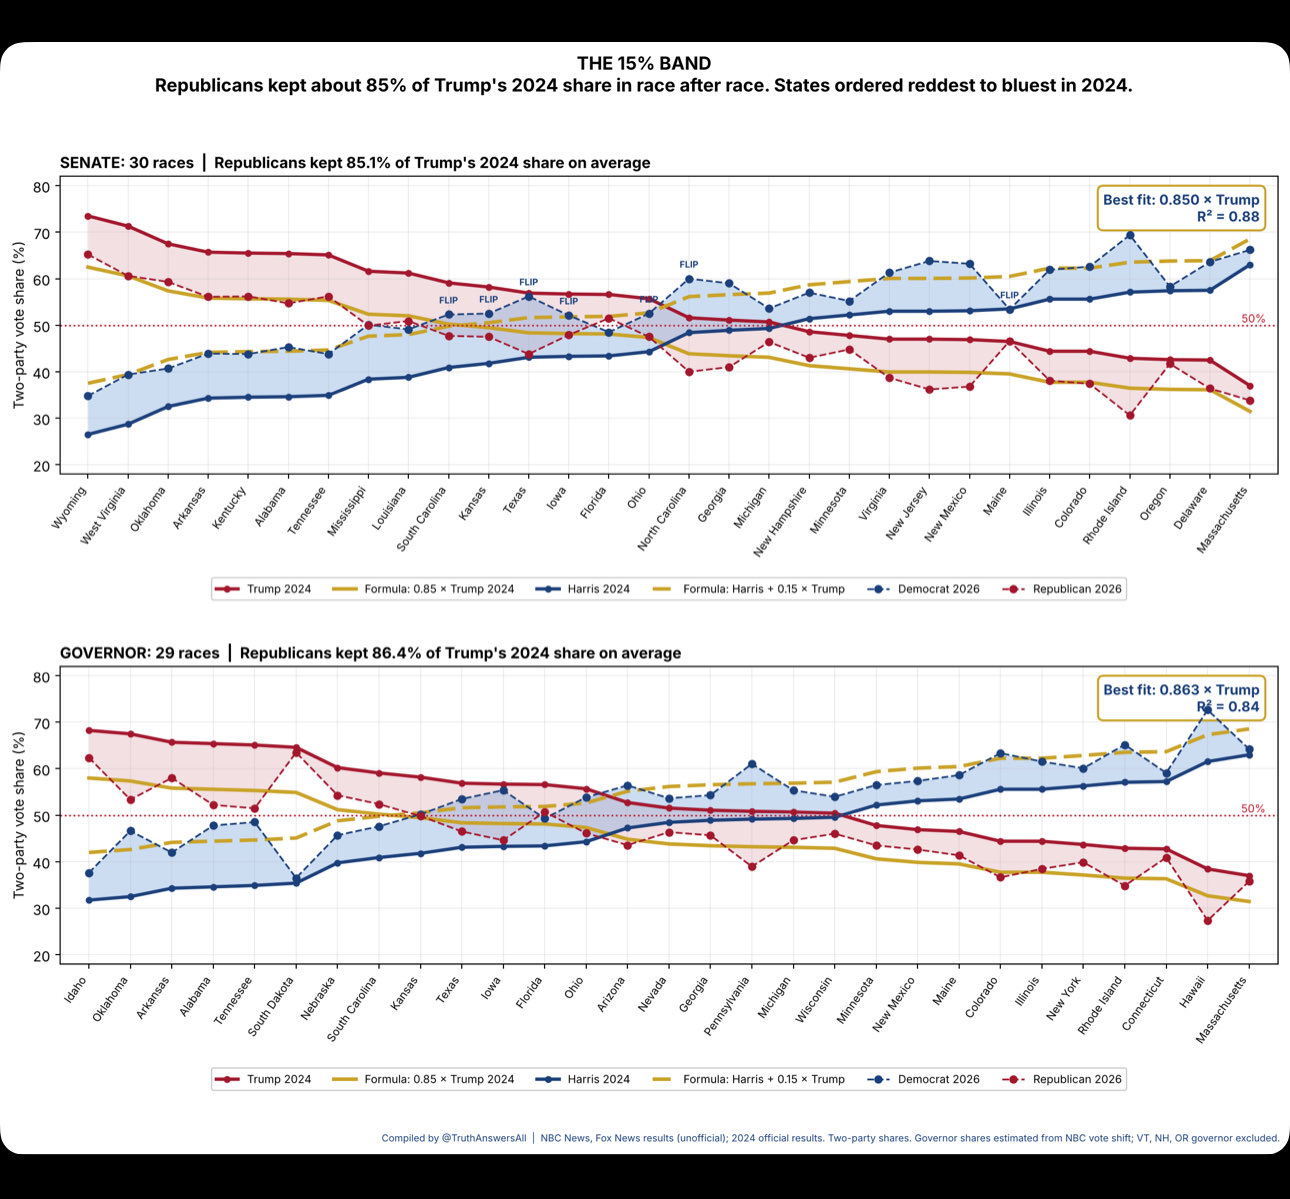
Supplied chart titled The 15% band. Senate and governor charts compare labeled 2024 Trump and Harris shares with 2026 race markers. Footer credit: @TruthAnswersAll.

Open the original image (1,290 by 1,199 pixels)

Senate and governor charts labeled The 15% band, comparing 2024 Trump and Harris shares with 2026 race markers.

Credit on the image: @TruthAnswersAll. Footer: NBC News and Fox News results (unofficial); 2024 official results; governor shares estimated; VT, NH, and OR governor excluded.

Provided image

Early votes, 2026 compared with 2024 final, as labeled on the supplied image
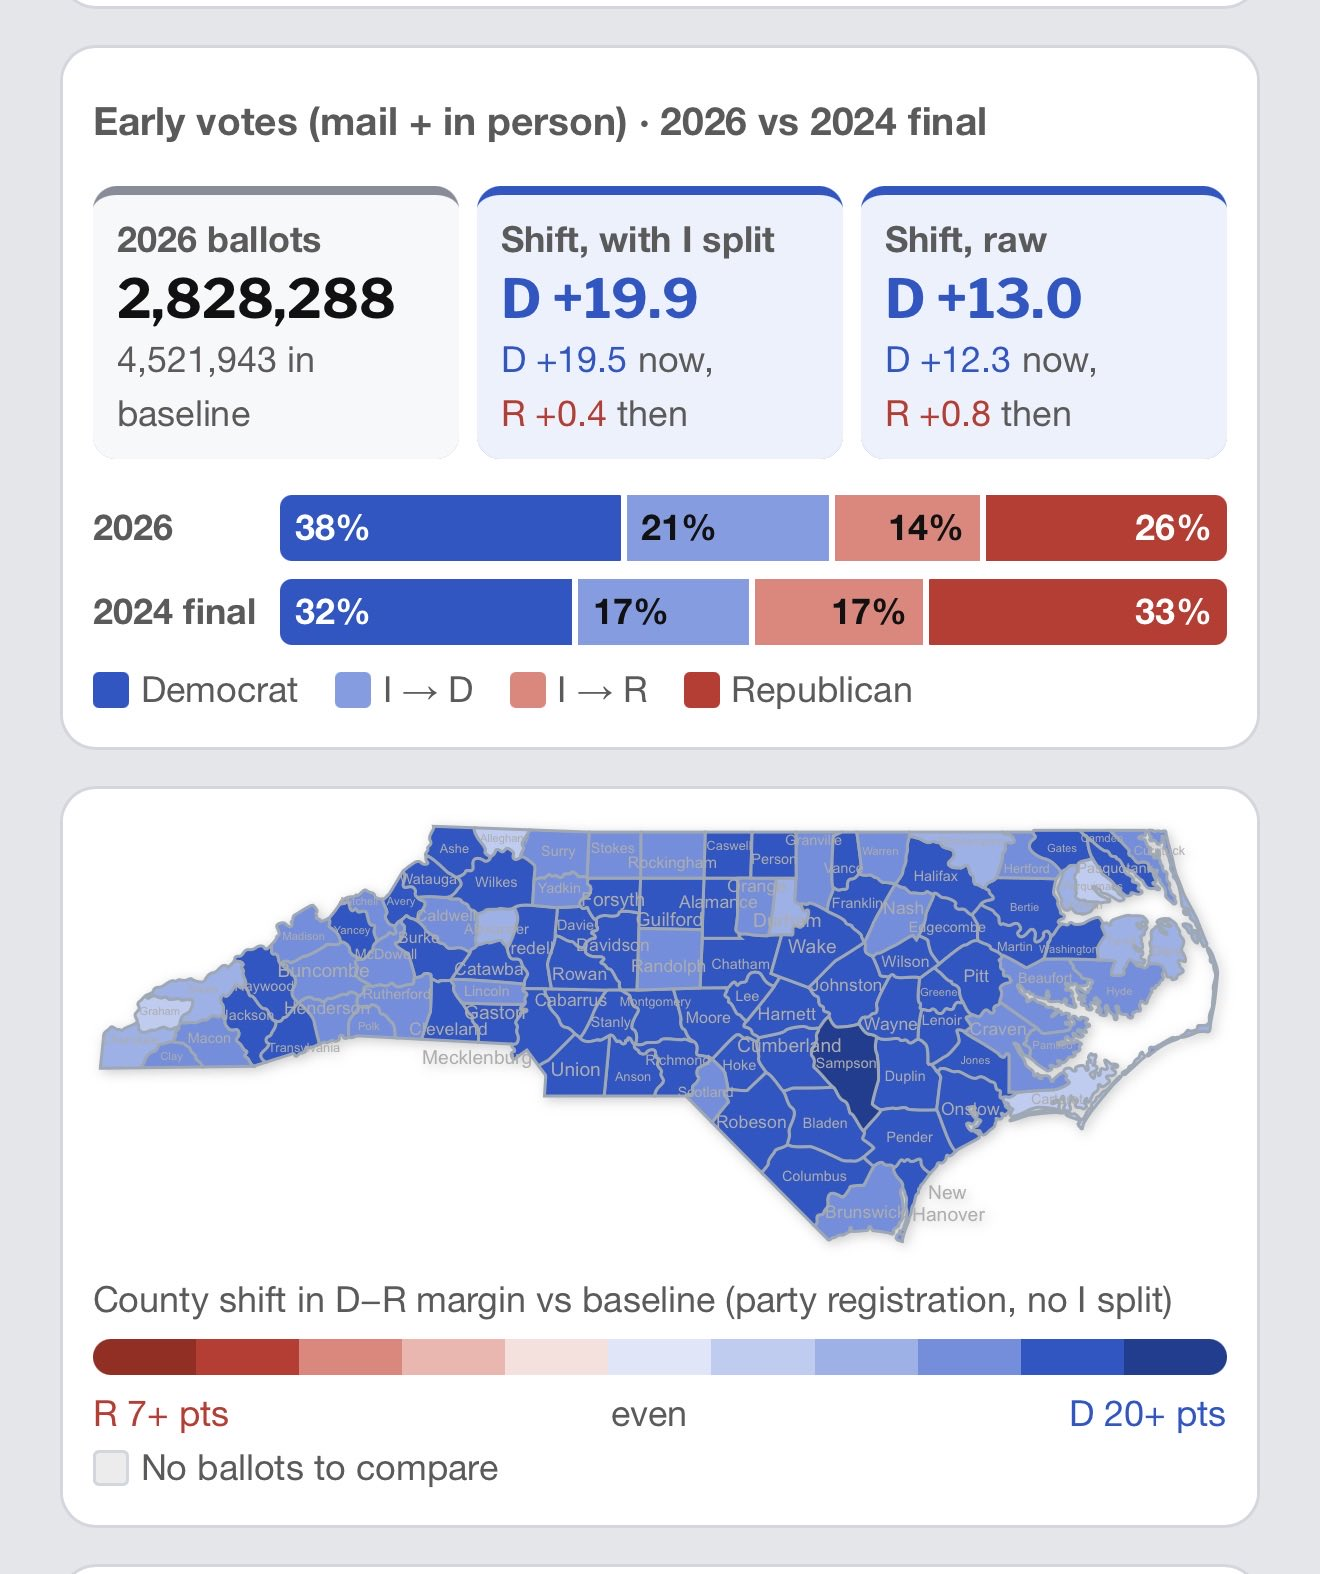
Supplied graphic titled Early votes, mail plus in person, 2026 versus 2024 final. Party-affiliation bars and a North Carolina county map labeled as a party-registration shift.

Open the original image (1,320 by 1,574 pixels)

Early votes, mail and in person, 2026 compared with 2024 final, as labeled. Includes a North Carolina county map of party-registration shift.

Source: Image provided by site owner. No source address on the image.

Provided image

Texas county-map comparison, 2016–2026
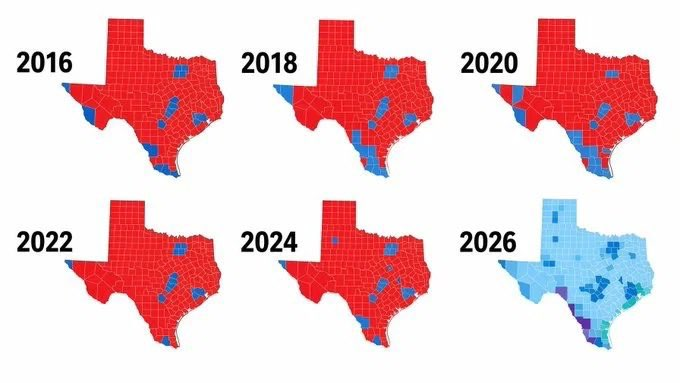
Six Texas county maps labeled 2016, 2018, 2020, 2022, 2024, and 2026.

Open the original image (680 by 383 pixels)

Texas county-map comparison, 2016–2026 (as labeled in supplied image); metric and source not supplied.

Illustrative sample charts

Sample data.
Sample data

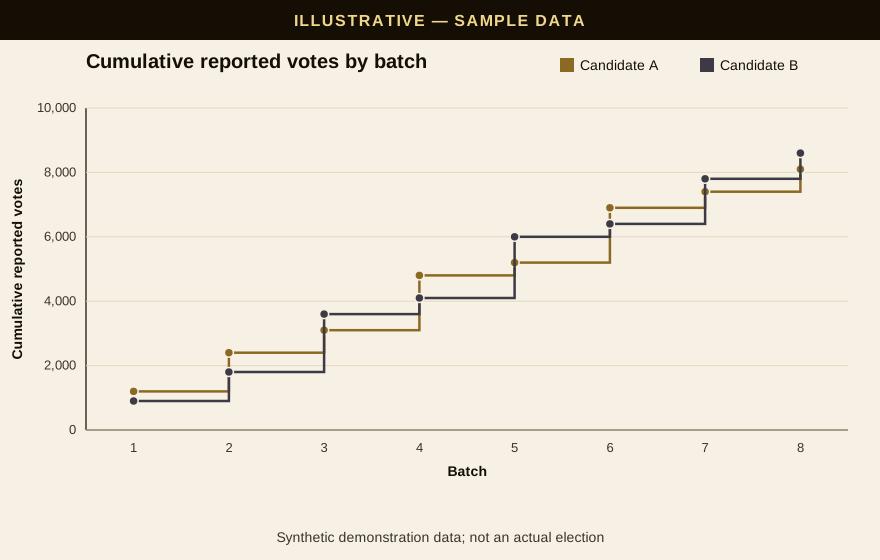
Cumulative reported votes by batch

Sample data. Cumulative reported votes by batch for Candidate A and Candidate B.

Open the chart

Sample data.

Sample data

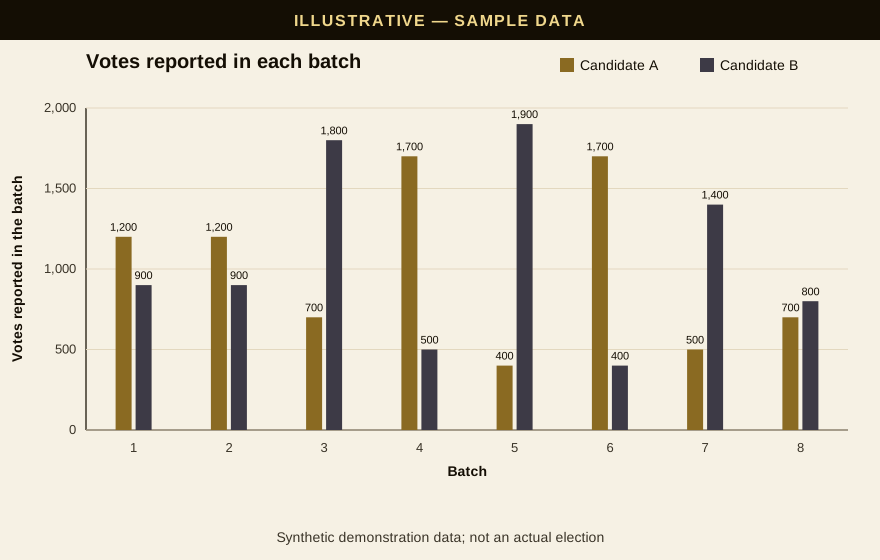
Votes reported in each batch

Sample data. Votes reported in each batch for Candidate A and Candidate B.

Open the chart

Sample data.

Sample data

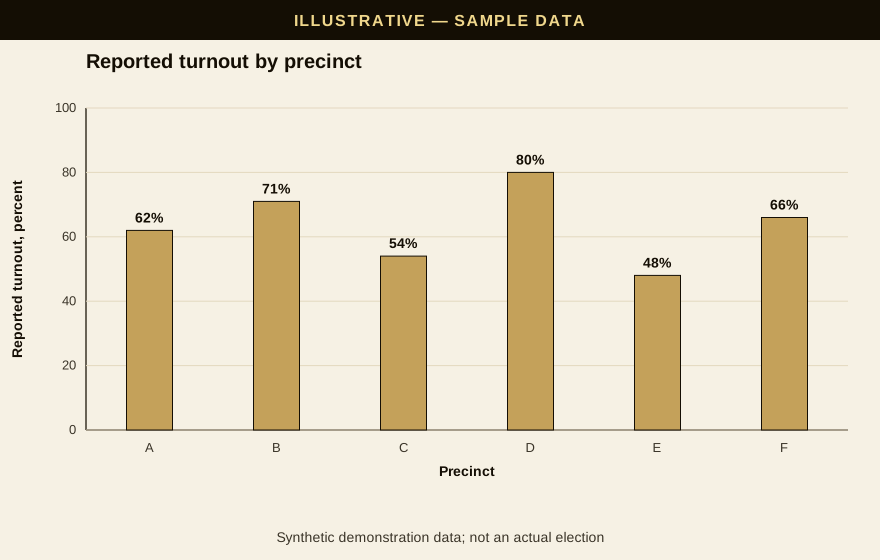
Reported turnout by precinct

Sample data. Reported turnout for Precincts A through F.

Open the chart

Sample data.